Session 9: Graphing in Stata
Interactive mode: click a code block or Show Plot button to reveal/hide its corresponding plot.
Script Walkthrough
* Load the NHANES dataset (assuming it's saved as NHANES.dta)
use "NHANES.dta", clear
* Data Preparation: Drop rows with missing values (equivalent to data_clean in R)
drop if missing(BMI) | missing(MaritalStatus) | ///
missing(Depressed) | missing(Poverty) | missing(Gender) | ///
missing(Age) | missing(SmokeNow) | missing(PhysActive) | ///
missing(HHIncomeMid)
* 1. Summary of Data
summarize BMI MaritalStatus Depressed HHIncomeMid Gender Age SmokeNow PhysActive
tabulate Gender
tabulate MaritalStatus
* 2. Basic Graphs
* 2.1. Histogram of BMI
histogram BMI, bin(30) color(ltblue) lcolor(black) ///
title("Histogram of BMI") xlabel(, noticks)
* 2.2. Boxplot of BMI by Gender
graph box BMI, over(Gender) ///
title("Boxplot of BMI by Gender") ///
ytitle("BMI")
* 2.3. Scatterplot of Age vs BMI with Transparency (Alpha)
twoway (scatter BMI Age, mcolor(blue%50) msymbol(circle) msize(medium)), ///
title("Scatterplot of BMI vs Age with Transparency") ///
ytitle("BMI") xtitle("Age")
* 3. Scatterplot with
* 3.1. Scatterplot of HHIncomeMid vs BMI by Gender with Transparency
twoway (scatter BMI Age, mcolor(blue%30) msymbol(circle) msize(small)), ///
by(Gender, title("Scatter Plot of BMI vs HHIncomeMid by Gender"))
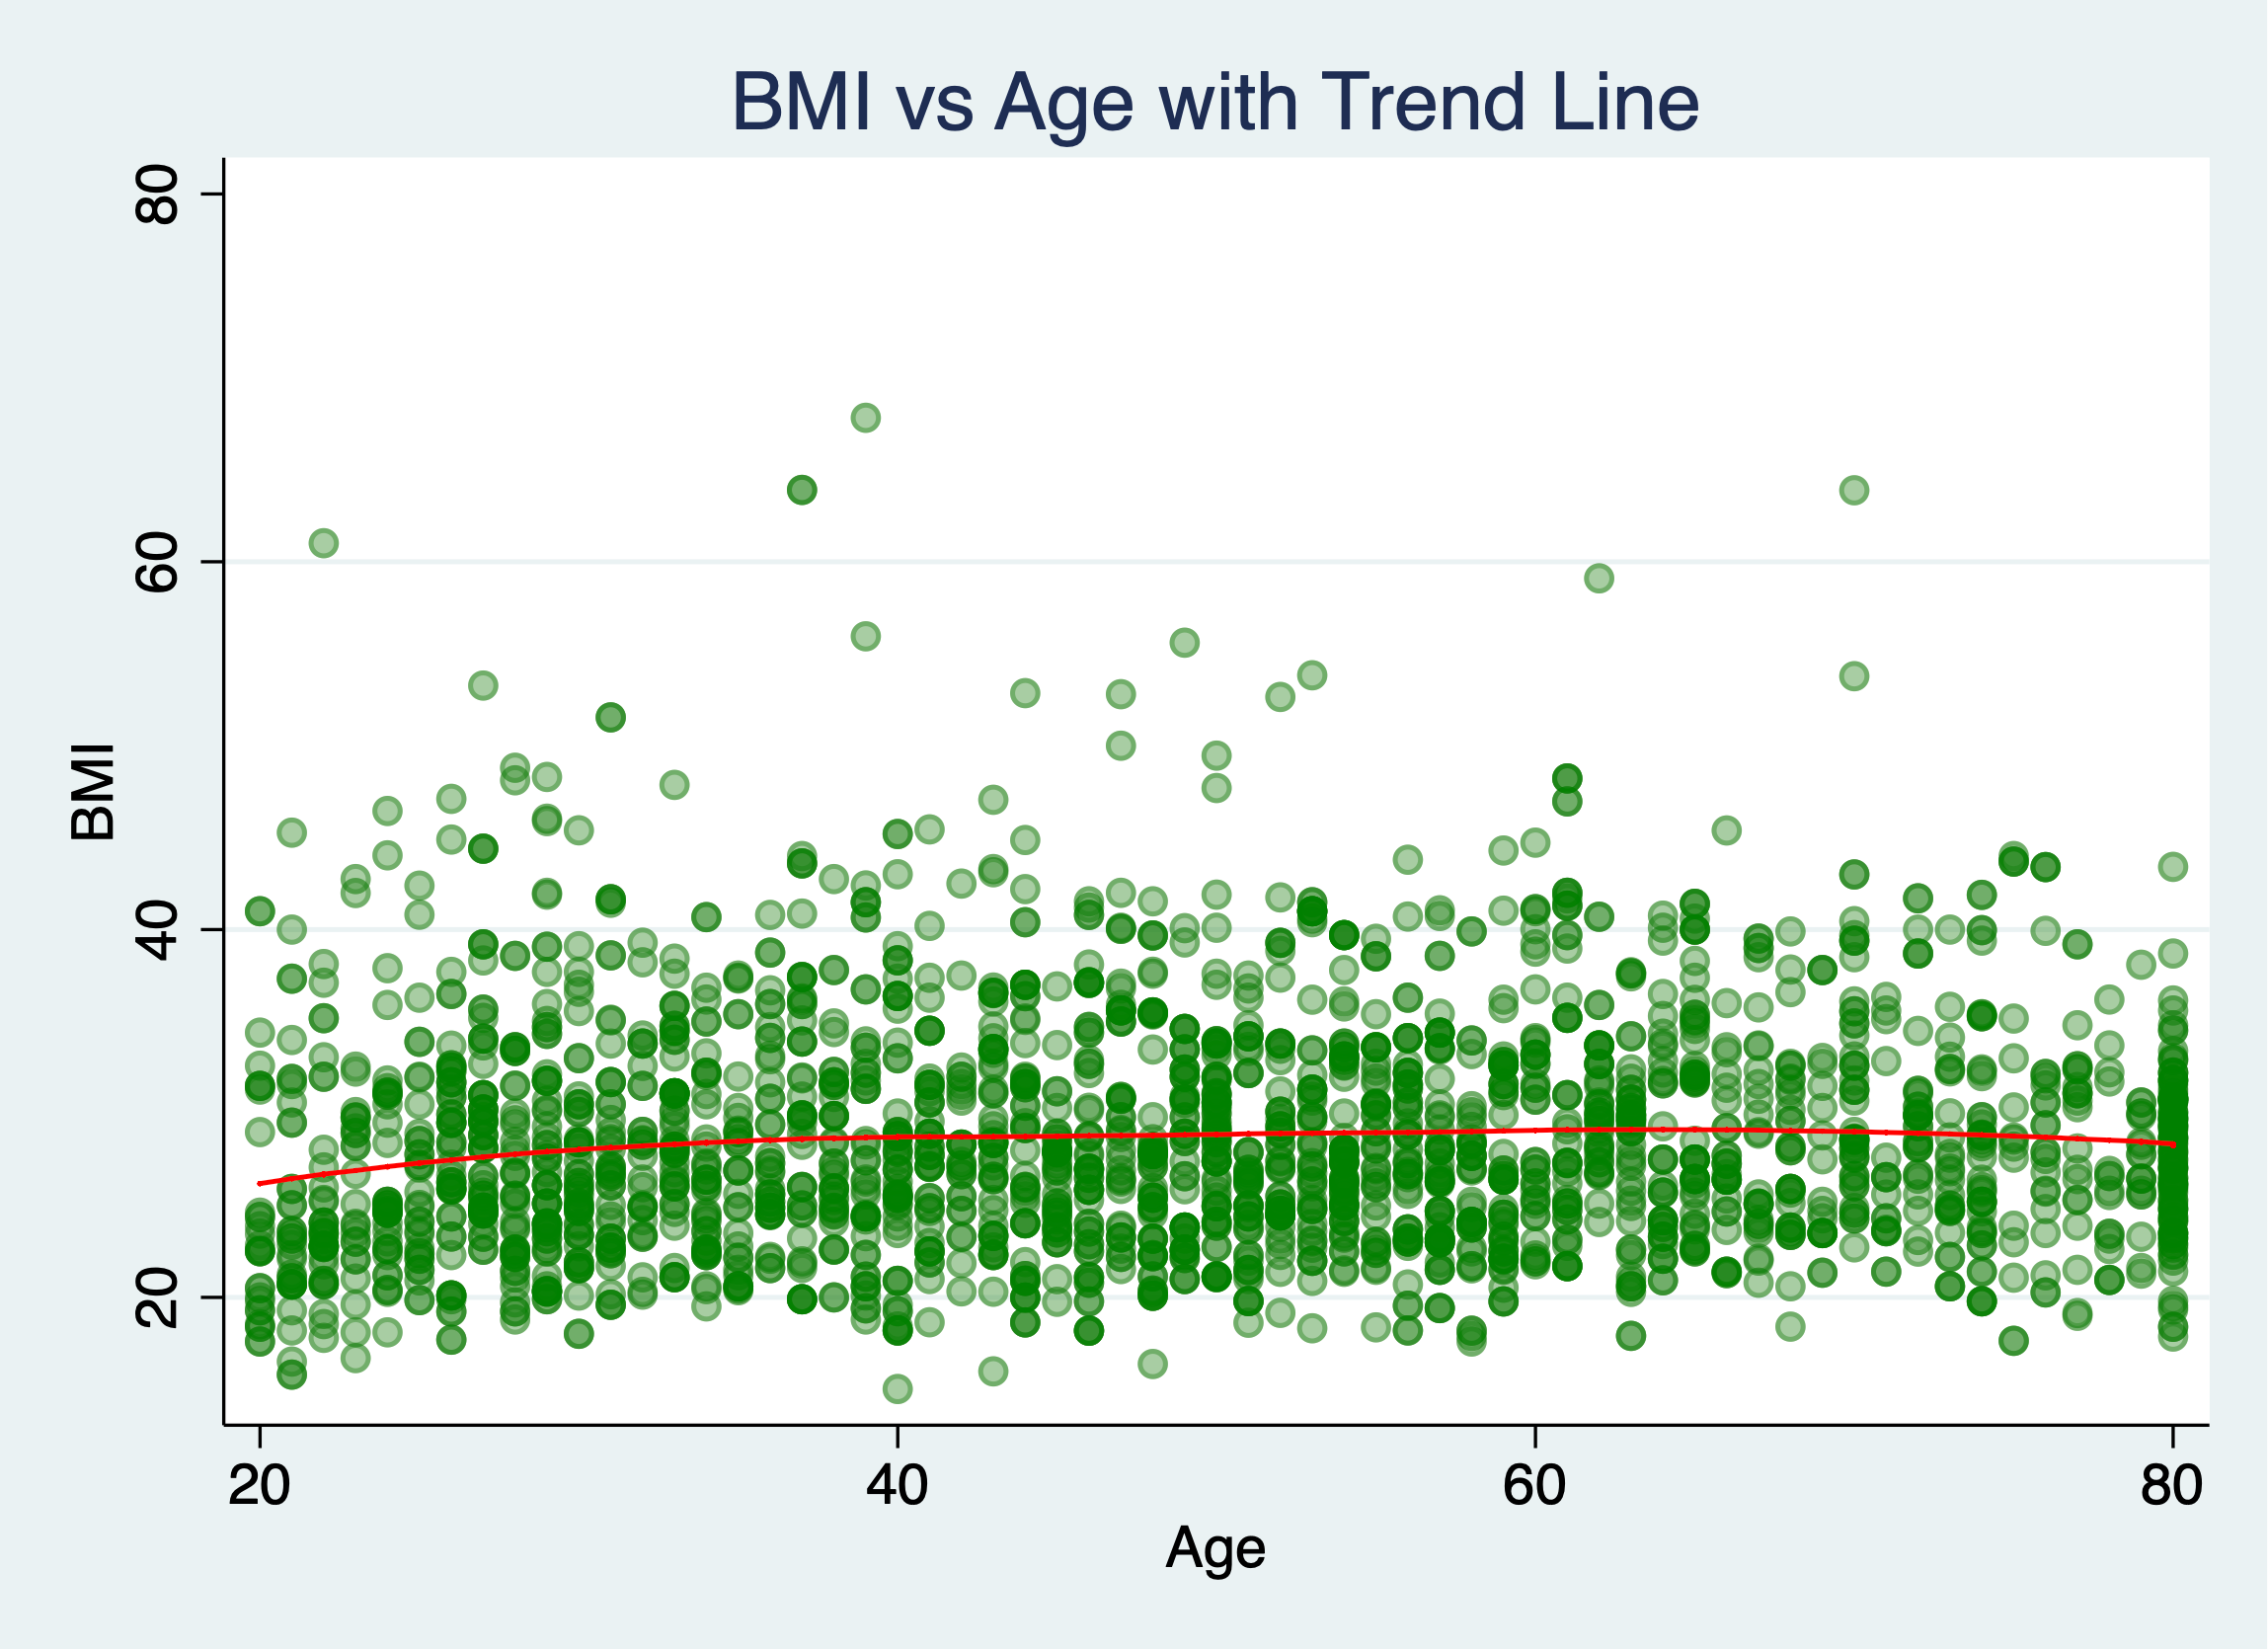
* 3.2. Scatterplot with LOESS Trend Line and Alpha
twoway (scatter BMI Age, mcolor(green%40) msymbol(circle) msize(medium)) ///
(lowess BMI Age, lcolor(red) lwidth(medium)), ///
title("BMI vs Age with Trend Line") ///
ytitle("BMI") xtitle("Age") legend(off)
* 3.3. Scatterplot with Linear Trend Line Faceted by Marital Status
graph twoway scatter BMI Age || lfit BMI Age, by(MaritalStatus) ///
title("BMI vs Age by Marital Status")
* 4. Bar Plot: Gender Distribution
graph bar (mean) BMI, over(Gender, label(angle(45))) ///
title("Mean BMI by Gender")
* 5. Boxplot of BMI by Depression Levels
graph box BMI, over(Depressed) ///
title("BMI by Depression Levels") ///
ytitle("BMI")
* Export all graphs as PDF for reporting
graph export "NHANES_Graphs.pdf", replacePlot Preview